The article shows how to use a list in python and Mathematica with a few examples. The examples come from An Elementary Introduction To The Wolfram Language
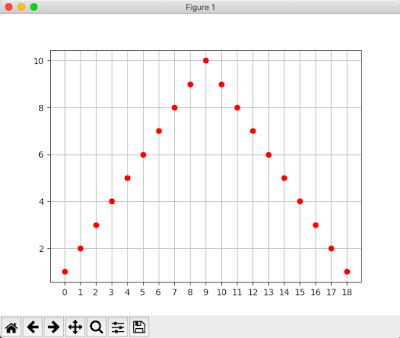
Plot a list that counts up from 1 to 10, then down to 1.
wolfram:
ListPlot[ Join[ Range[10],Reverse[Range[9] ] ] ]

python:
import matplotlib.pyplot as plt

data1 = list( range( 1, 11 ) )
data2 = data1.copy()
data2.reverse()
data2.pop( 0 )
data1.extend( data2 )
print( data1 )

x = list( range(len( data1 )) )
print( x )
plt.grid( True )
plt.plot( x, data1, "ro" )
plt.xticks( x ) # adjust unit length of X axis
plt.show()
output:
[1, 2, 3, 4, 5, 6, 7, 8, 9, 10, 9, 8, 7, 6, 5, 4, 3, 2, 1]
[0, 1, 2, 3, 4, 5, 6, 7, 8, 9, 10, 11, 12, 13, 14, 15, 16, 17, 18]

Use Range and RandomInteger to make a list with a random length up to 10.
wolfram:
Range[ RandomInteger[10] ]
![]()
python:
import random

value = random.randint(1, 10) # create value that 1 <= value <= 10
print( value )

print( list( range( 1, value+1 ) ) )
output:
9
[1, 2, 3, 4, 5, 6, 7, 8, 9]
[Finished in 1.1s]

