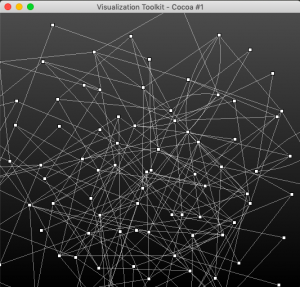
vtkGraphLayoutView is a subclass of vtkGraphLayoutView which has own renderer, renderWindow, command observer, actor and etc.
The following code shows how to use it to display a 2D image.
from vtk import *

def main():
    # create a random graph
    source = vtkRandomGraphSource()
    source.SetNumberOfVertices(100)
    source.SetNumberOfEdges(110)
    source.StartWithTreeOn()
    source.Update()

    arcParallelStrategy = vtkArcParallelEdgeStrategy()

    # set the strategy on the layout
    graphLayoutView = vtkGraphLayoutView()
    graphLayoutView.SetEdgeLayoutStrategy( arcParallelStrategy )
    graphLayoutView.AddRepresentationFromInput( source.GetOutput() )
    graphLayoutView.GetInteractor().Start()

if __name__ == '__main__':
    main()

The following code learned from VTKUsersGuide.
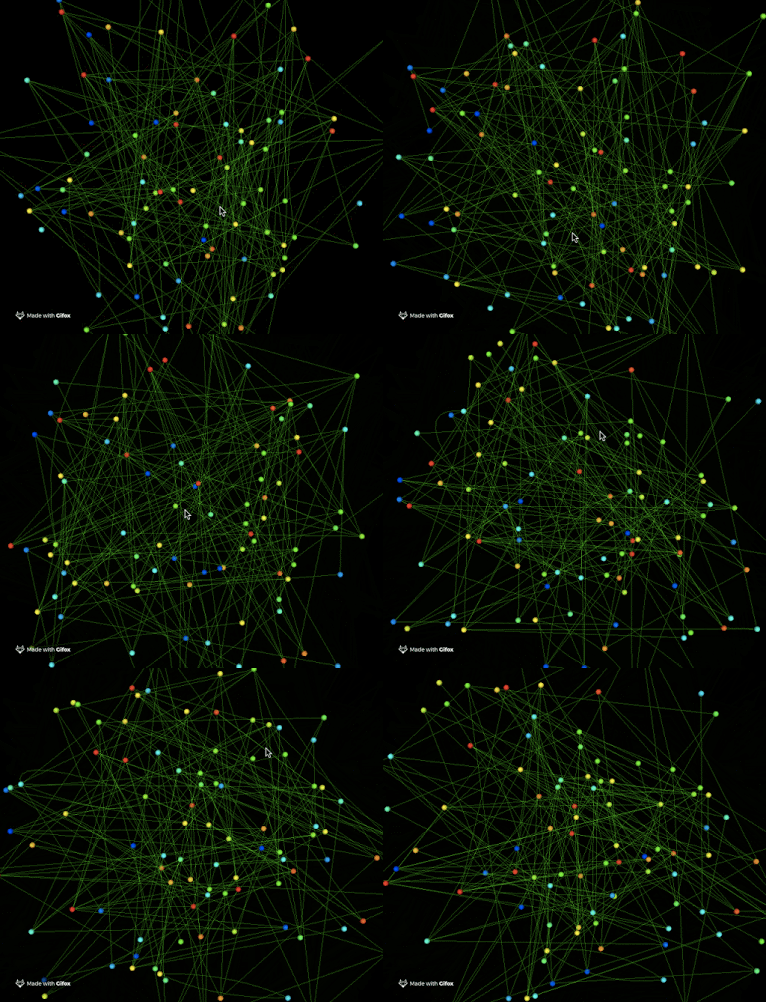
It shows how to convert vertexes to vtkGlygh polydata and how to convert a vtkGraph to a vtkPolyData.
from vtk import *

# create a random graph
source = vtkRandomGraphSource()
source.SetNumberOfVertices(100)
source.SetNumberOfEdges(110)
source.StartWithTreeOn()
source.Update()

# setup a strategy for laying out the graph
strategy = vtkRandomLayoutStrategy()
strategy.SetGraphBounds( 0, 200, 0, 200, 0, 200 )
strategy.SetThreeDimensionalLayout( True )

# set the strategy on the layout
layout = vtkGraphLayout()
layout.SetLayoutStrategy(strategy)
layout.SetInputConnection(source.GetOutputPort())

ren = vtkRenderer()

# Pipeline for displaying vertices - glyph -> mapper -> actor -> display
# mark each vertex with a special glyph
vertex_glyphs = vtkGraphToGlyphs()
vertex_glyphs.SetInputConnection(layout.GetOutputPort())
vertex_glyphs.SetGlyphType(9) #sphere
vertex_glyphs.FilledOn()
vertex_glyphs.SetRenderer(ren)

vertex_mapper = vtkPolyDataMapper()
vertex_mapper.SetInputConnection( vertex_glyphs.GetOutputPort() )
vertex_mapper.SetScalarRange( 0, 100 ) # 100 vertexes.
vertex_mapper.SetScalarModeToUsePointFieldData()
vertex_mapper.SelectColorArray("vertex id")

# create the actor for displaying vertices
vertex_actor = vtkActor()
vertex_actor.SetMapper( vertex_mapper )

# Pipeline for displaying edges of the graph - layout -> lines -> mapper -> actor -> display
edge_strategy = vtkArcParallelEdgeStrategy()
edge_layout = vtkEdgeLayout()
edge_layout.SetLayoutStrategy( edge_strategy )
edge_layout.SetInputConnection( layout.GetOutputPort() )
edge_geom = vtkGraphToPolyData()
edge_geom.SetInputConnection( edge_layout.GetOutputPort() )

# create a mapper for edge display
edge_mapper = vtkPolyDataMapper()
edge_mapper.SetInputConnection( edge_geom.GetOutputPort() )

# create the actor for displaying the edges
edge_actor = vtkActor()
edge_actor.SetMapper( edge_mapper )
edge_actor.GetProperty().SetColor( 0., 1., 0. )
edge_actor.GetProperty().SetOpacity(0.25)

ren.AddActor( edge_actor )
ren.AddActor( vertex_actor )
ren.SetBackground( 0, 0, 0 )

renWin = vtk.vtkRenderWindow()
renWin.AddRenderer( ren )

renWinInteractor = vtk.vtkRenderWindowInteractor()
renWinInteractor.SetRenderWindow( renWin )
renWinInteractor.Start()

The sentence vertex_glyphs.SetGlyphType(9) means we want vertexes to look like spheres.
the enum
  {
    VERTEX = 1,
    DASH,
    CROSS,
    THICKCROSS,
    TRIANGLE,
    SQUARE,
    CIRCLE,
    DIAMOND,
    SPHERE
  };


